
 |
Eager Space | Videos | All Video Text | Support | Community | About |
|---|

There's a widespread belief that NASA is the right US organization to guide human spaceflight - that they are "the pros" at this and everybody should defer to them.
But are they?
This video looks at how reliability is managed in aerospace and NASA's history in that area.
We'll start by defining two terms.
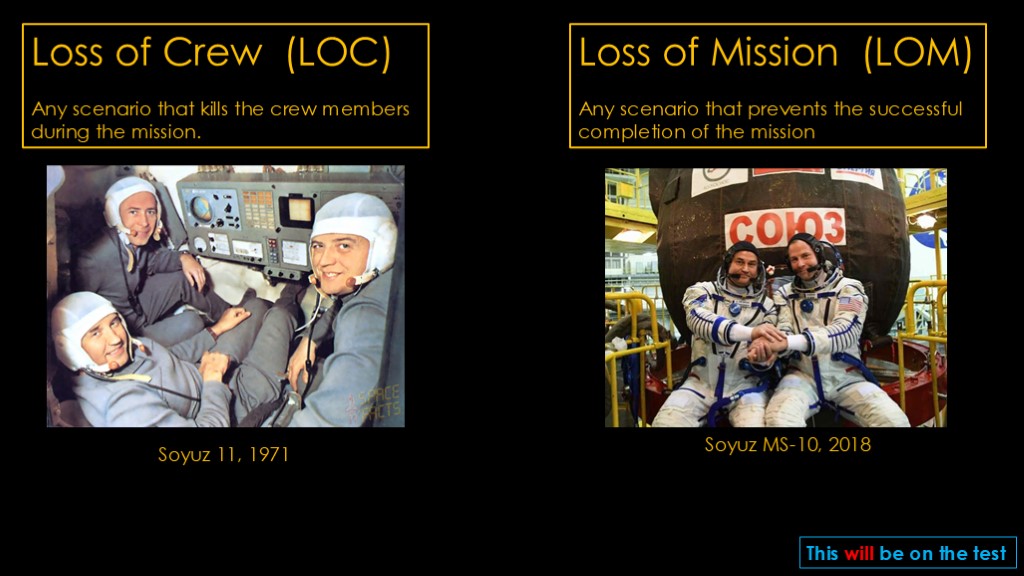
Loss of Crew - or LOC - is any scenario that kills the crew members during the mission.
To pick a lesser-known example, in 1971 the Soyuz 11 crew was killed during reentry when an air vent opened and depressurized their capsule.
Loss of Mission - or LOM - is any scenario that prevents the successful completion of the mission but does not kill any crew members.
In 2018, the launch vehicle on the Soyuz MS-10 flight to the international space station malfunctioned, but the abort system worked correctly and they landed safely.
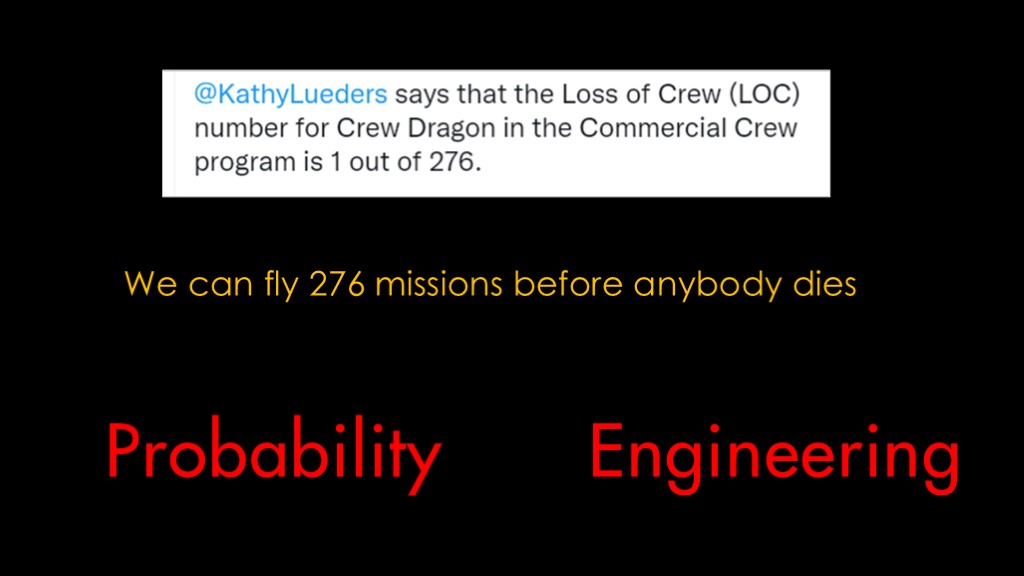
Here's an relevant tweet.
Kathy Lueders ("leaders") (head of commercial crew for NASA) says that the LOC number of SpaceX's Crew Dragon is 1 out of 276.
One out of 276. What does that number mean?
The implication is that we can fly 276 missions before anybody dies.
But that's not what it really means, for two reasons.
The first reason is because of how probability works, and the second is because of how those numbers are generated

We will start with a journey to the land of math, a land that is populated with many strange and confusing symbols.
We will travel to Probabilistan, and we will start with...

Backgammon...
For our purposes, you need to know two facts about backgammon:
Doubles are very useful, as they give you four moves instead of two
Double sixes are highly prized
We're going to look at the probability of getting double sixes.

We know that the chance of rolling a six is one in 6, so the chance of rolling double sixes is one in 36, or about 0.028 (2.8%)
How many times do I need to roll to get double sixes? 1 in 36, so 36, right?
Any backgammon player can tell you that it's not 36 times. You might roll them the very first roll of the game, or you might roll 100 times without getting them.
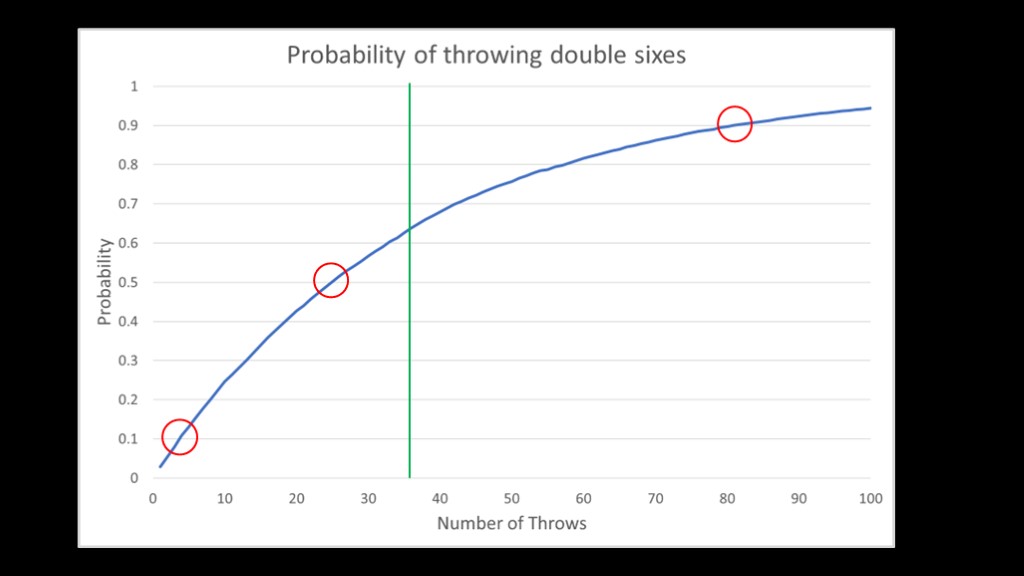
Here's a graph from a simulation that rolled dice until it got double sixes and tracked how many throws it took. It did this 10,000 times. The green line shows 36 throws.
What can we figure out from this chart?
First, ten percent of the time we will thrown double sixes in the first 4 rolls. That's very lucky if we are playing backgammon, very unlucky if we are flying a spacecraft.
Second, if we throw the dice 25 times there is a 50/50 chance that we get double sixes. I think the 50/50 point is probably the most useful one to think about from a risk perspective; if our risk is 1 in 36, we have a 50% chance of a LOC in 25 flights.
As a rule of thumb, take the denominator (36 in this case) and multiply it by two thirds, and you'll get pretty close to the 50/50 number.
Third, the 90% point is at 82 throws. We have a 10% chance of rolling or flying 82 times or more before the happy or unhappy event occurs.
Note also that this smooth curve comes from doing this 10,000 times. We generally don't have that amount of data.

There are two places these numbers come from.
Empirical numbers come from measurements in the real world.
Analytical numbers come from performing analysis of the underlying system.
We'll start with some empirical numbers from the aviation industry
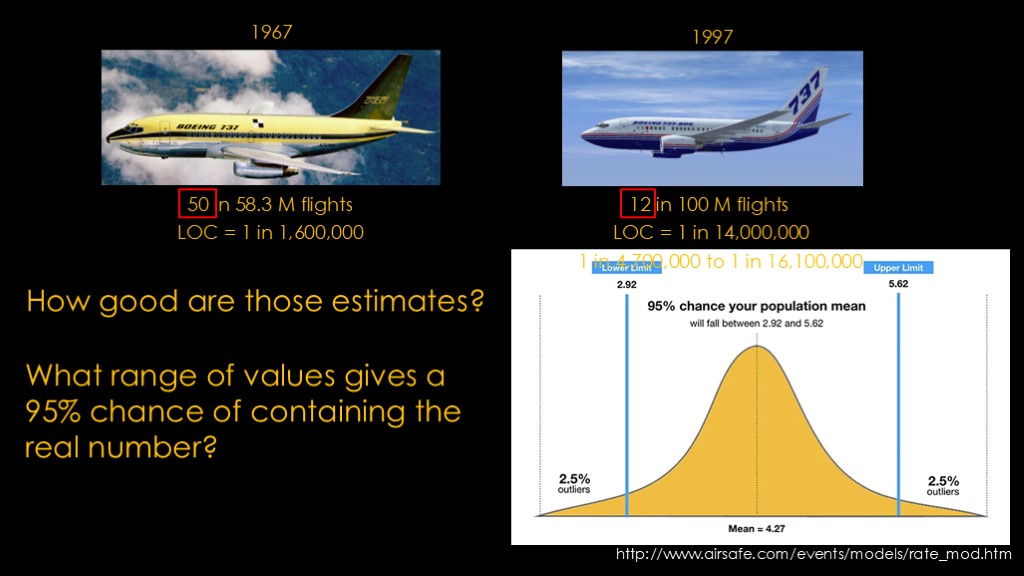
Aviation doesn't use the term "loss of crew", but we can come up with equivalent numbers.
The Boeing 737 was launched in 1967, and it had 50 fatal events in about 58 million flights. That gives us a measured LOC of one in 1.6 million.
In 1997, Boeing launched the 737-600 series, and it had 12 events in 100 million flights, for a LOC of about one in 14 million.
That's an order of magnitude improvement in about 30 years, and it came from improvements in design but also because of improvements in operations, maintenance, and flight crew training.
How good are those estimates? Look at the numbers in red. Both planes had a number of incidents and that makes it more likely that the numbers we calculate are good. As backgammon players know, while the outliers do happen, over time everything balances out towards the 50/50 spot.
It may be useful to ask a different question - what range of values gives a 95 percent chance of the range containing the real number
This is calculated using a confidence interval, where our real number is 95% likely to be between the two limits. Note, however, there's still a 5% chance that it could be outside those limits.
If we apply that calculation to the 737-600, we find that there's a 95% chance that the real number is between 1 in 4.7 million and 1 in 16.1 million.
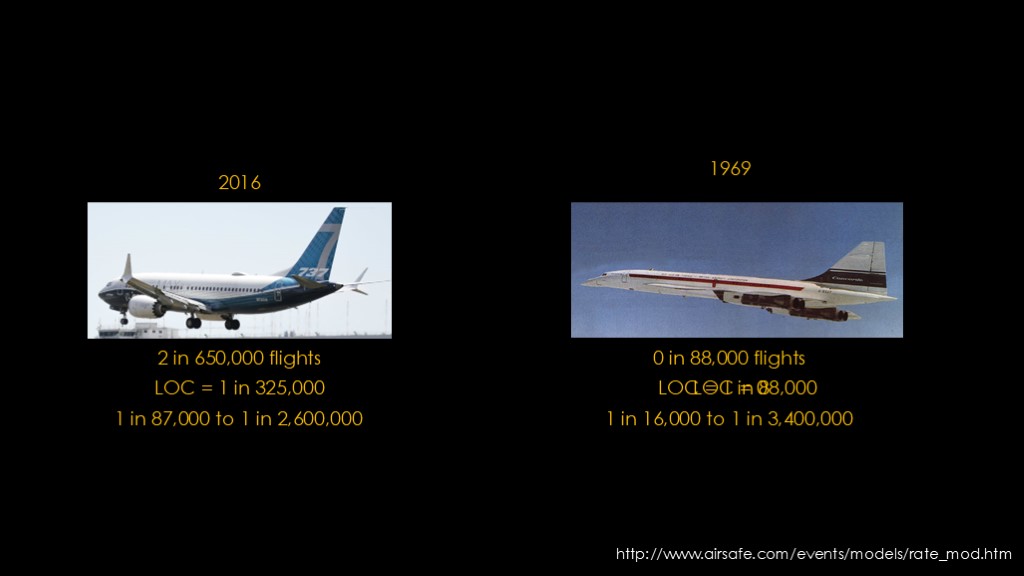
Let's look at two more planes...
In 2016, Boeing launched the 737 Max. It had two fatal events in the first 650,000 flights, for a measured LOC of one in about 325,000. Much, much worse than the 737-600 series.
But the most interesting example is the Concorde. It first flew in 1969, and flew for 31 years with a perfect safety record for 88,000 flights. Then it crashed on takeoff in 2000, and that gives it a measured LOC of one in 88,000.
Let's add in the 95% confidence intervals. The 737-MAX has a range of 1 in 87,000 to 1 in 2.6 million. It's unlikely that it is close to the safety of the 737-600.
The concorde has a range from 1 in 16,000 all the way up to 1 in 3.4 million. It could be a very risky plane, or it could be safer than the early 737. We simply do not have enough data.
This demonstrates a significant limitation of the empirical method; it doesn't work well with small numbers of events.
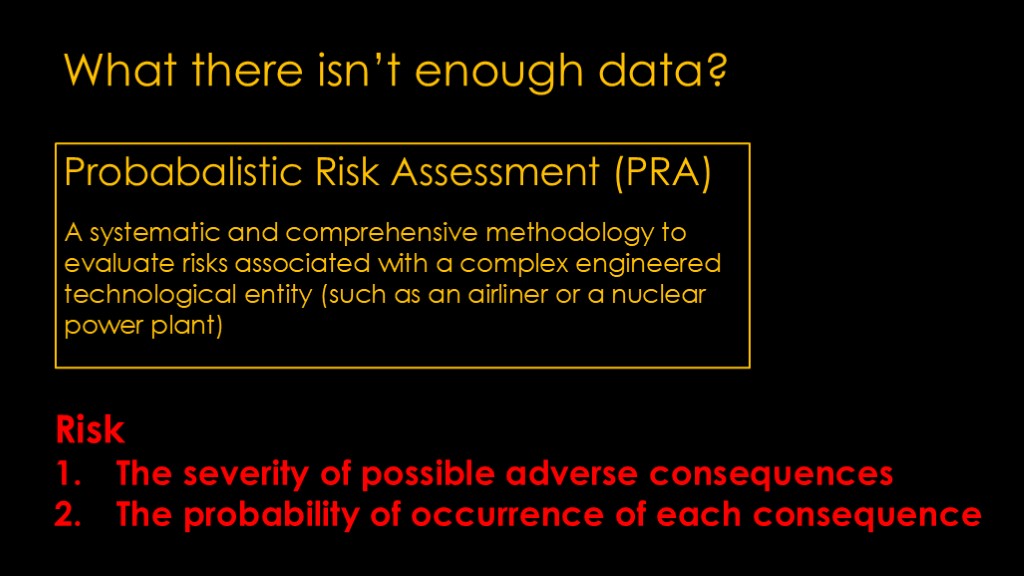
What if events are very rare or it's a new vehicle?
You can use a technique called probabilistic Risk Assessment, which is designed to evaluate risk with complex technology.
To greatly oversimplify the process, risk is computed using two quantities:
The severity of possible adverse consequences
And
The probability of occurrence of each consequence.
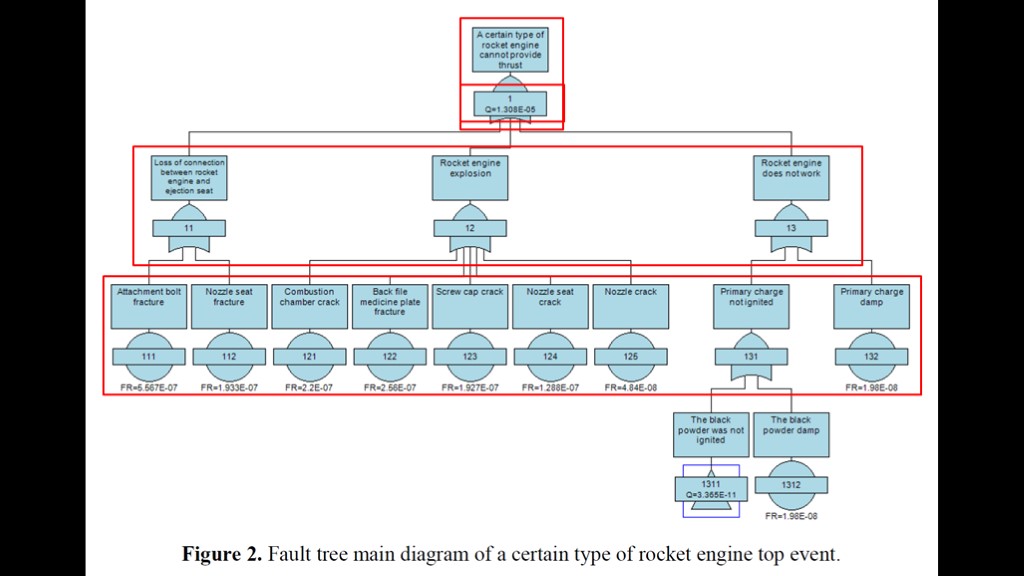
This is often done with fault trees analysis.
This is the fault tree diagram for a rocket engine on an ejection seat. The top node shows the overall failure, and the three nodes underneath show situations that would lead to the overall failure:
The rocket engine is not connected to the ejection seat
The rocket engine explodes
The rocket engine does not work
Underneath each of those are sub-scenarios, and then, sometimes, sub-sub scenarios, with the tree continuing many levels deep
Each of those sub-scenarios has a specific probability estimated for it, and then those probabilities flow up to provide an estimated overall probability - in this case, 1 in about 77,000.
Each probability comes from an analysis of how likely a specific issue is.
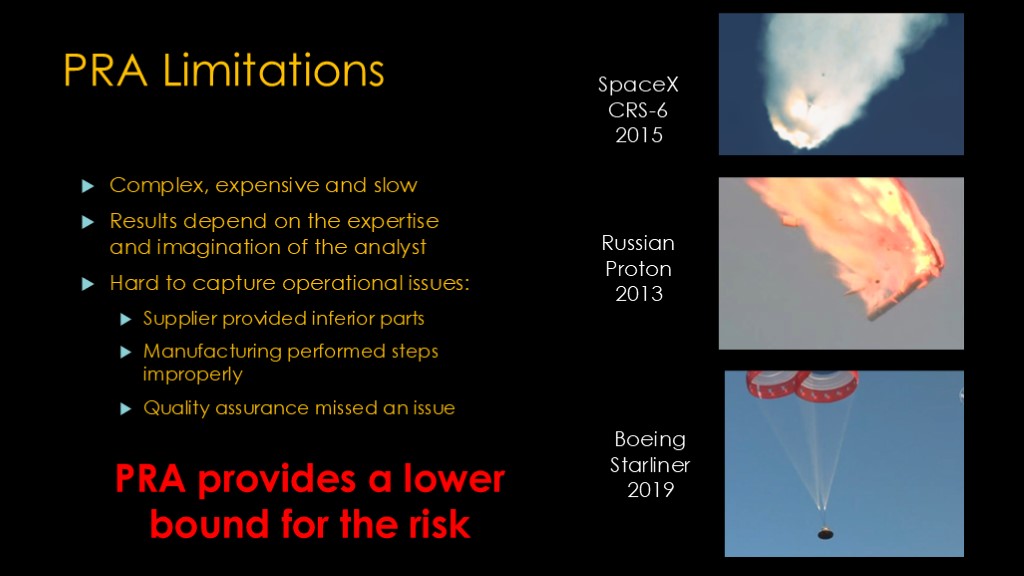
What are the limitations of this approach?
First, it's complex, expensive, and slow - and it needs to be kept up-to-date as designs change.
Second, the results depend on the expertise and the imagination of the analyst; scenarios that the analyst does not think of do not exist in the analysis.
Third, it is hard to capture operational issues. Here are a few examples of the kind of issues that are difficult to foresee:
In 2015, the second stage on SpaceX's CRS-6 mission exploded because struts from a supplier did not meet specifications.
In 2013, a Russian Proton rocket exploded because three sensors were installed in an improper orientation.
In 2019, a Boeing Starliner abort test parachute failed because it was not connected to the parachute harness.
Because of these limitations, PRA provides a lower bound for the risk; the actual risk may be higher.
Now let's move to some examples at NASA.
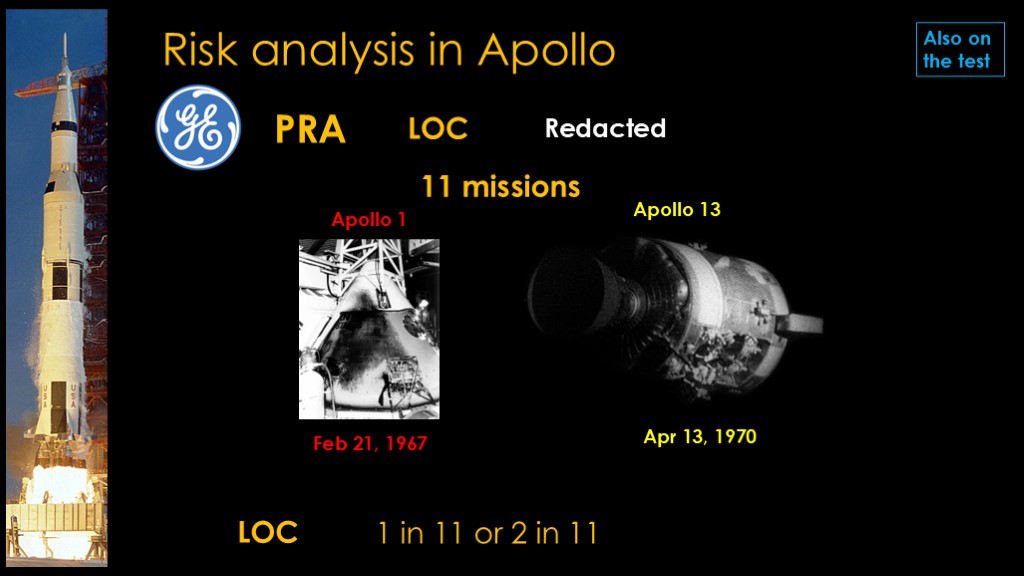
Early in Apollo, NASA commissioned General Electric to do a probabilistic risk assessment for the apollo program.
The number NASA got back from GE said that there was a 10% or less chance of success. NASA was worried about the reaction such a number would create if widely known, so NASA kept the number secret.
And they decided to avoid PRA analysis in the future.
We therefore have no updated PRA for the actual Apollo missions, but we can maybe estimate it.
Apollo had 11 missions with humans on it.
In 1967, a fire broke out in the Apollo 1 capsule during a test and killed three astronauts.
In 1970, Apollo 13 blew up an oxygen tank in the service module, which very nearly became a LOC incident.
That gives us a LOC measurement of 1 in 11, maybe 2 in 11 if you count Apollo 13.
What did NASA learn about reliability from Apollo?
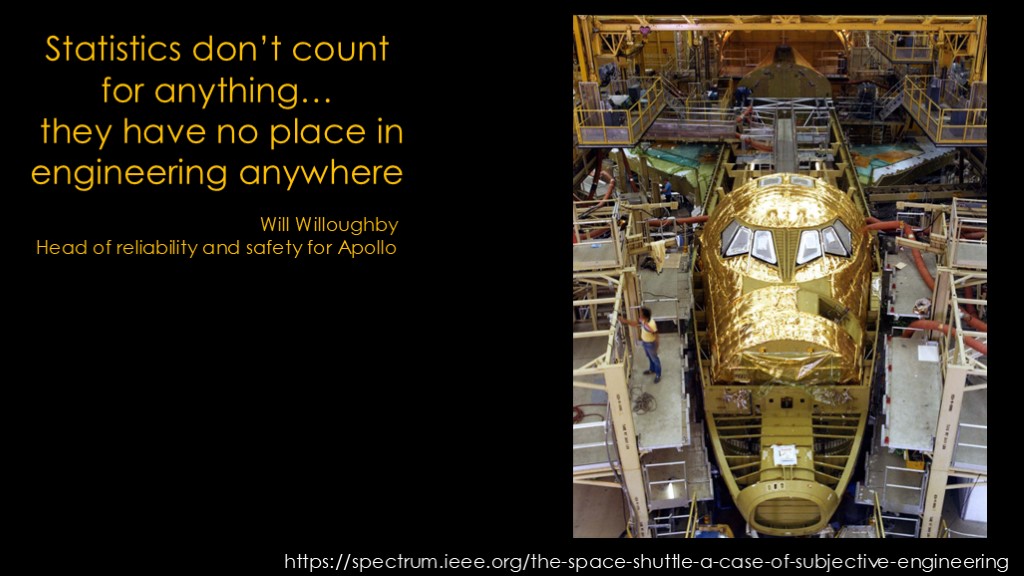
Here's a quote from Will Willoughby, head of reliability and safety for Apollo
Statistics don't count for anything... they have no place in engineering anywhere.
The Apollo approach rolled right into the shuttle program
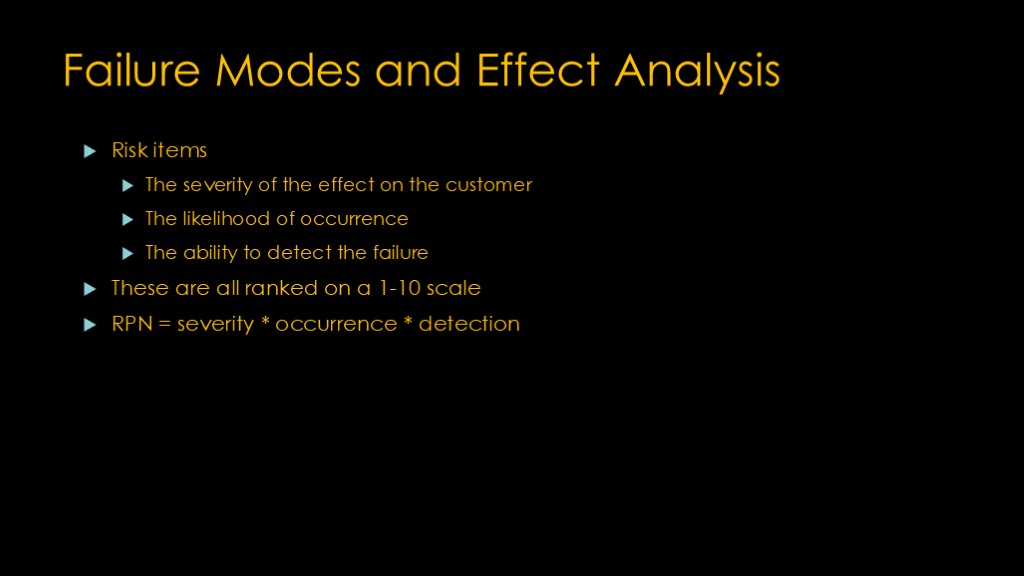
With their disdain for statistical methods like PRA, NASA instead chose failure modes and effects analysis.
FMEA looks at three things:
The severity of the effect on the customer
The likelihood of occurrence
The ability to detect the failure
These are all ranked on a 1-10 scale, and then multiplied together to produce a risk priority number.
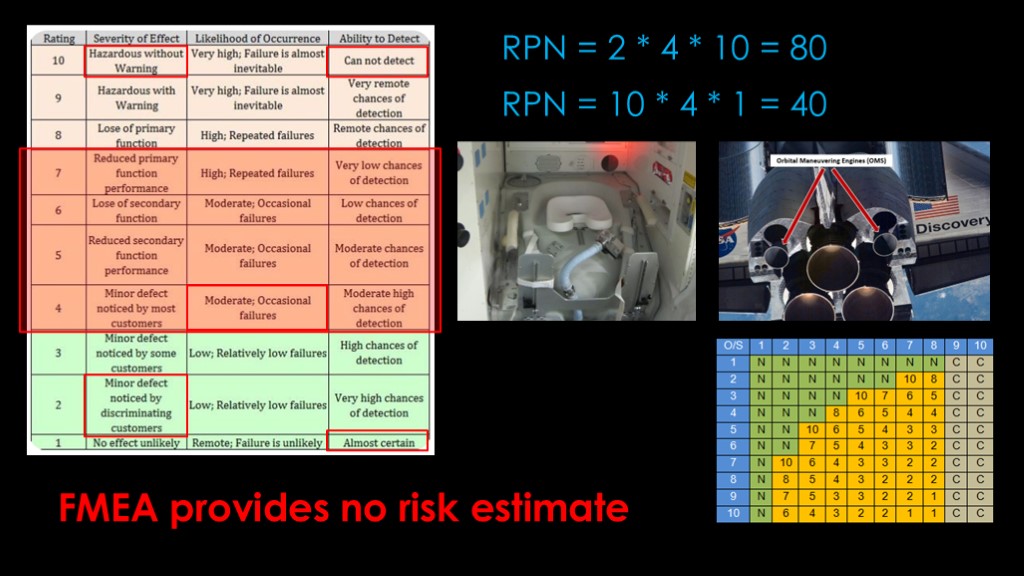
Here is a table that describes how to come up with those three numbers.
Let's look at a couple of examples:
We have a minor defect that shows up occasionally and we can not detect it. That gives us an RPN of 2 times 4 times 10, or 80
Or
We have a defect that is immediately hazardous, shows up occasionally, but we can always detect it. That gives an RPN of 10 times 4 times 1, or 40
Wait, what? A minor problem that is very hard for us to detect rates *higher* than a major issue that we can always detect? That might rank a problem with the shuttle toilet higher than a failure in the maneuvering thrusters that would prevent the crew from returning
This is one of the issues with FMEA. Some organizations instead use a risk ranking table that ignores the ability to detect number.
There's another issue because FMEA is done by people, and most people are human. As humans, we like the middle of ranges - the 4-7 range in these rankings. They are comfortable. The big numbers are less comfortable and likely require more effort to justify, so the ratings we give are going to be pushed more towards the middle of the scale. That tends to mush things together.
The biggest issue, however, is one you've probably already noticed. FMEA provides no risk estimate.
How did that work out for shuttle?
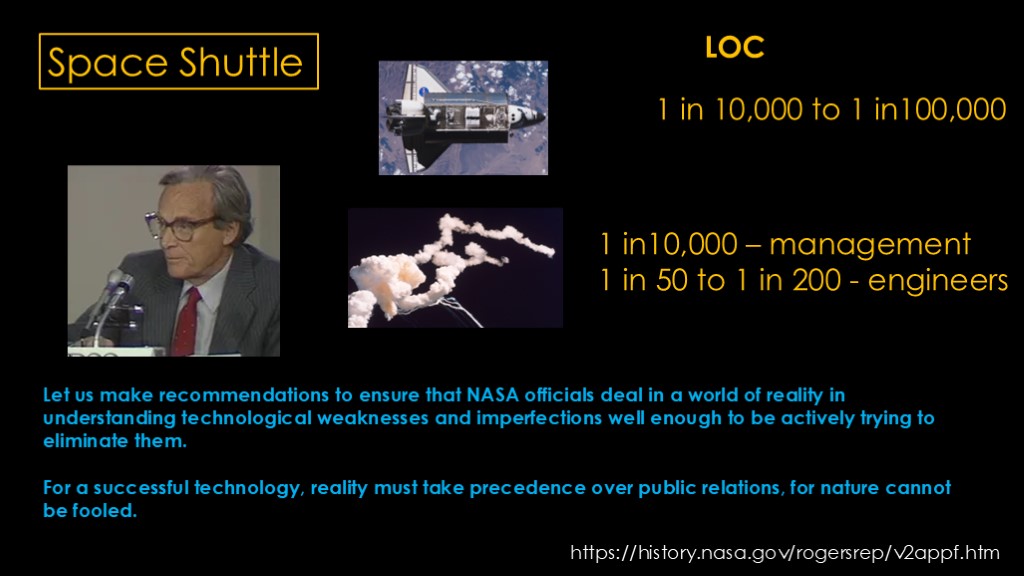
Well, at the beginning of the space shuttle program, NASA was quoting an LOC number of 1 in 10,000 to 1 in 100,000. Getting close to airplane numbers. To put that in perspective, the 1 in 10,000 number means that if you flew shuttle weekly for 133 years, you would have a 50/50 chance of losing a crew.
Then Challenger happened on the 25th flight of shuttle
Richard Feynman, the well-known and well-respected physicist and Nobel Laureate was part of the investigation commission, and he did a deep investigation into the reliability of shuttle and wrote a detailed analysis. Here's a link if you are interested.
As part of his analysis, Feynman polled NASA employees on what they thought the LOC number was. Management's number was 1 in 10,000.
Engineers estimated 1 in 50 to 1 in 200.
Feynman finished his analysis with the following: (read)

I would be remiss in my responsibilities if I mentioned Richard Feynman and didn't mention two very interesting and enjoyable books. His later books are also good.
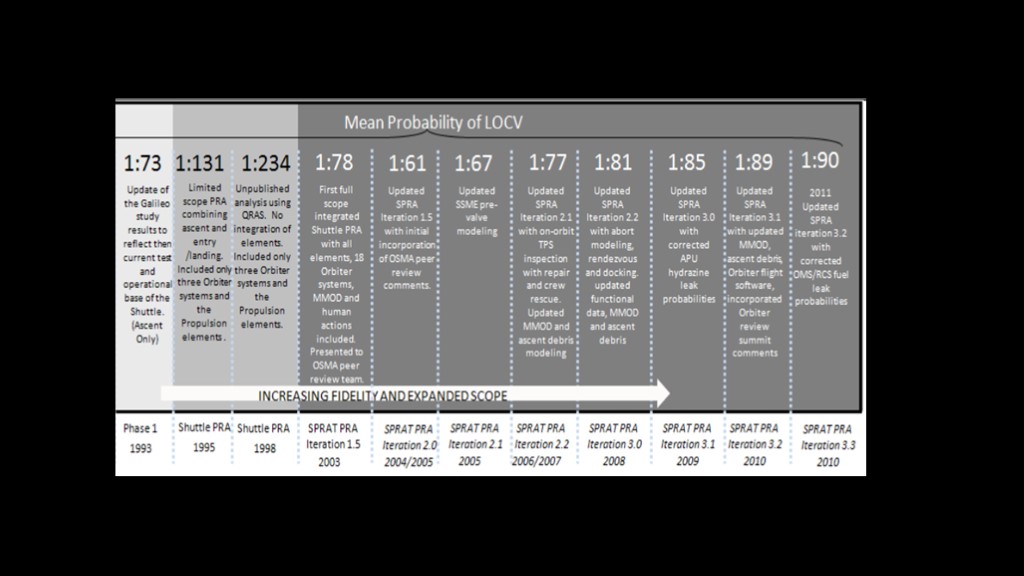
After challenger, NASA started doing limited PRA analysis, but they didn't complete a full PRA analysis until 17 years later, in 2003, the same year of the Columbia Disaster.
That analysis was updated as the program progressed. Interestingly, they didn't just evaluate the current PRA but updated the PRA for the whole program lifetime, and that gives us a very interesting diagram.
*****
https://ntrs.nasa.gov/api/citations/20110004917/downloads/20110004917.pdf
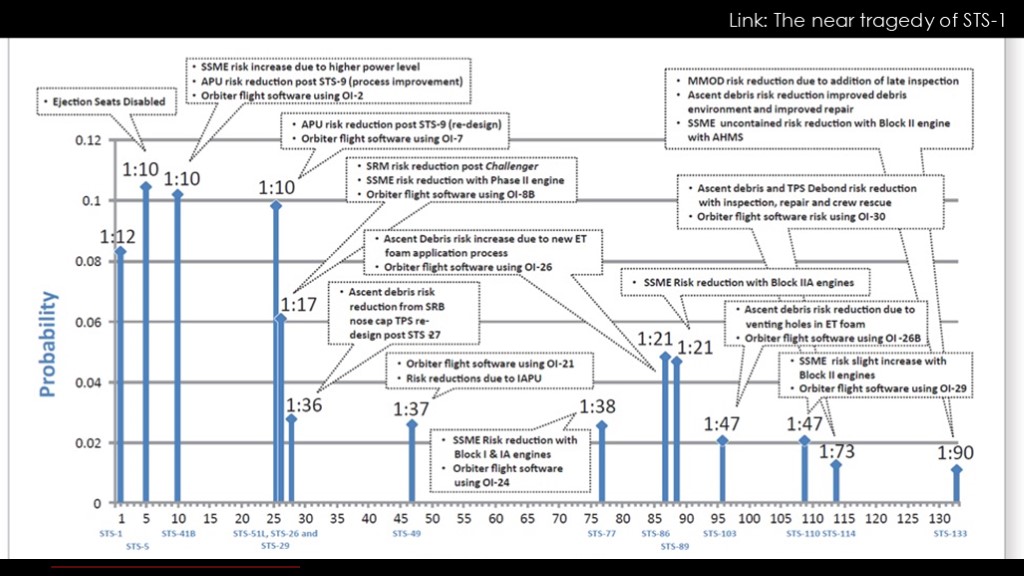
We'll start with the early years.
The first obvious question is "where is challenger?" It shows up right here, with a risk of 1 in 10.
The estimate for the whole early period is a 1 in 10 probability of LOC. Note that there was almost a LOC event on STS-1; I'll put a link to my video in the upper corner.
After challenger, the risk only decreased from 1 in 10 to 1 in 17, despite the widespread impression that it was a much safer vehicle.
This middle section is concerning; that jump from 1 in 38 to 1 in 21 is an increase of 80%, due purely to a new way of applying foam to the external tank.
A bit later we see Columbia, in a section labelled at 1 in 47.
And finally - right at the end - we end up with the 1 in 90 figure, but it really only applies at the end.
The empirical value - two failures in 135 flights - is about 1 in 68. Given the numbers on the chart, it's tempting to suggest that NASA got lucky, especially given the other close calls in the program.
*****
https://ntrs.nasa.gov/api/citations/20110004917/downloads/20110004917.pdf
https://www.thespacereview.com/article/3785/1
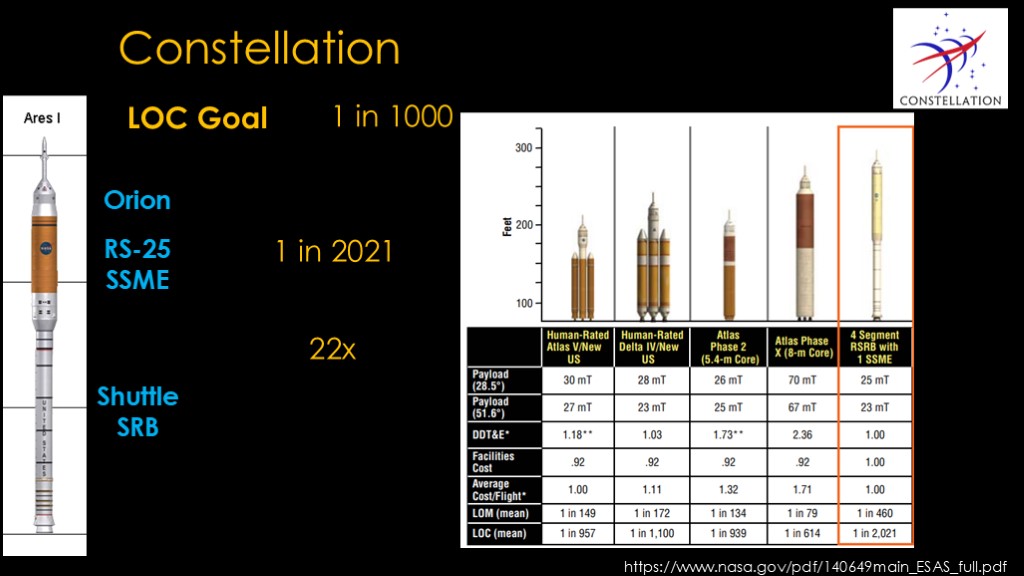
As shuttle was winding down, NASA was doing a lot of work on the upcoming Constellation program. The astronaut office noted that it would be nice if the next launch system was less likely to kill astronauts, and proposed an LOC goal of 1 in 1000.
The Ares 1 rocket was the crew delivery vehicle in Constellation, and it was built using a Shuttle solid rocket motor as the first stage, a single RS-25 space shuttle main engine in the second stage, and then an apollo-ish Orion capsule with escape system on top.
NASA presented their reliability numbers in the final study on Constellation, and estimated the LOC number at 1 in 2021.
Note that this number is 22 times better than the shuttle numbers.
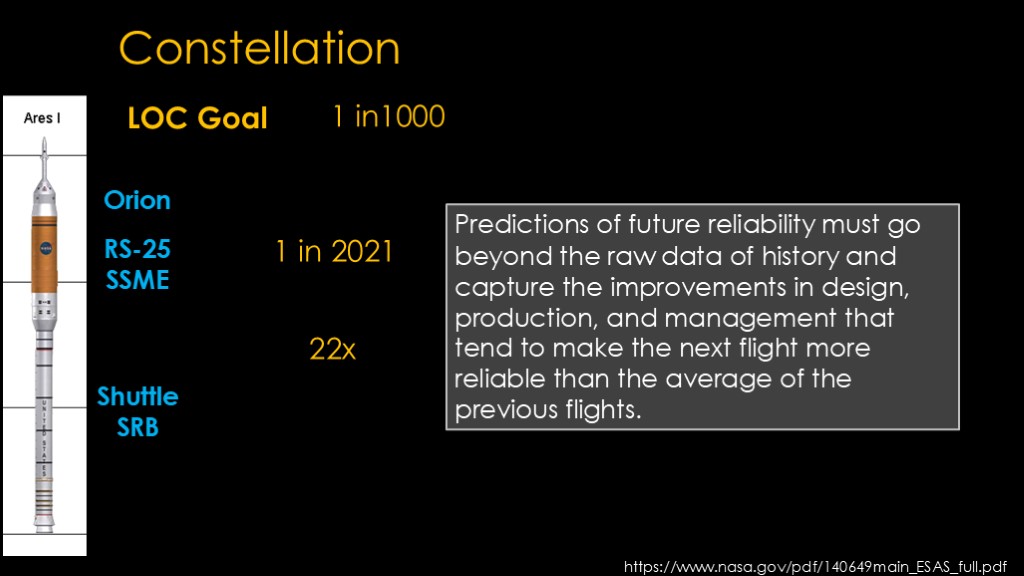
Here's one of my favorite quotes from the Constellation reliability study.
Predictions of future reliability must go beyond the raw data of history and capture the improvements in design, production and management that tend to make the next flight more reliable than the average of the previous flights.
This basically says that we should ignore the historical numbers - shuttle numbers, I assume - because we've learned so much since then. Despite the fact that shuttle showed that this assertion was very much not true - the shuttle did not get more reliable because of the flights before Challenger or Columbia, and the 1 in 90 number is at the end of shuttle, reflecting a more mature program than constellation.
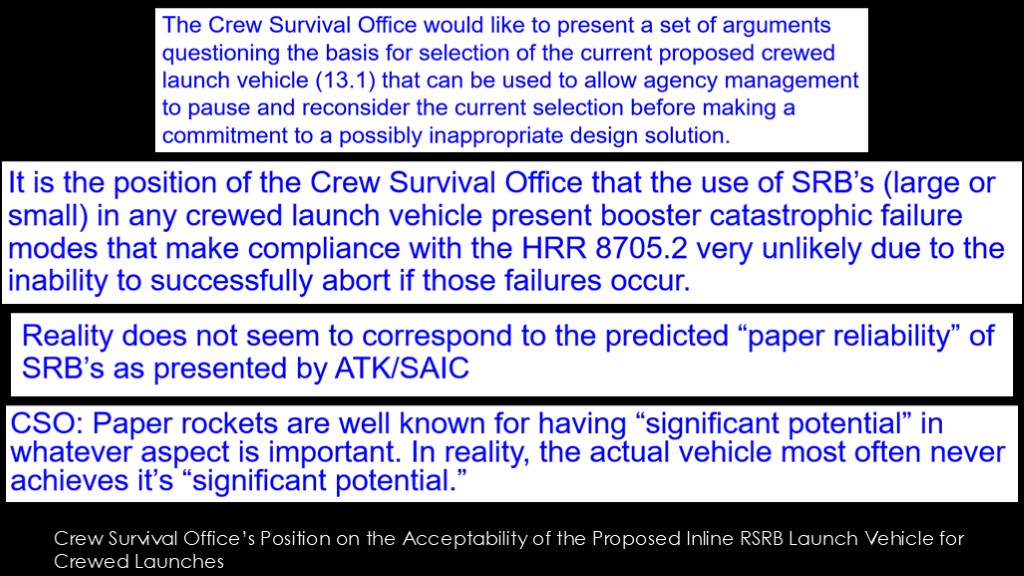
When the Ares I solid rocket design was announced, the crew survival office went nuts - at least, "went nuts in a very NASA engineer way"
Here are some excerpts from their report.
The whole constellation program was cancelled, but that's a story for a different video..
After constellation, nasa was working on the space launch system - or SLS - and continuing work on the Orion capsule.
Detailed information on PRA efforts for SLS and Orion were hard to locate.
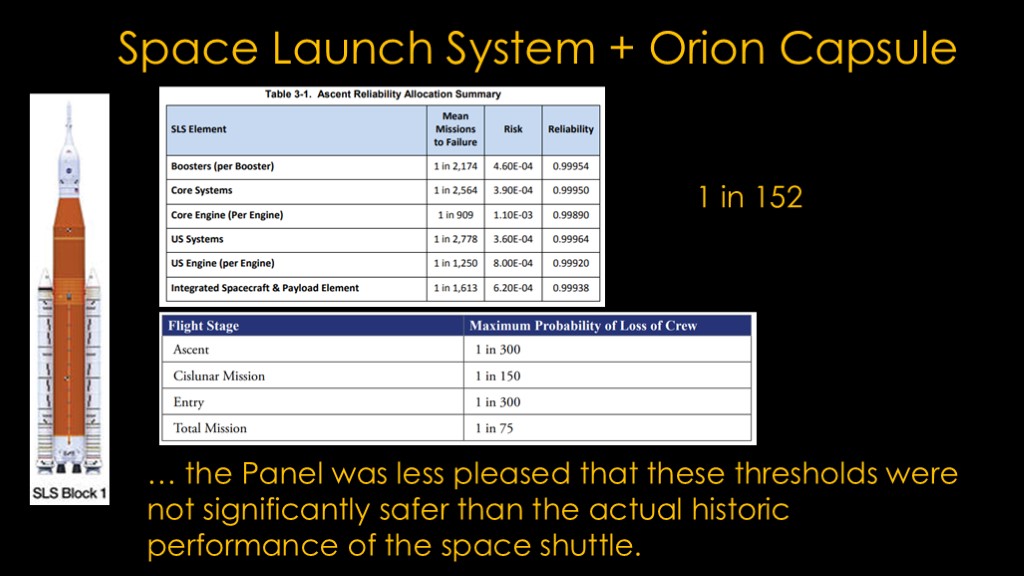
I found this table from 2013 that looks at the ascent reliability. If you take those numbers and calculate an aggregate reliability, it comes out to 0.993429, or 1 in 152. Note that this number is just for ascent.
The Aerospace Safety Advisor Panel Annual report for 2014 published this table, which looks at the LOC for a trip around the moon, similar to what the upcoming Artemis 1 mission will do.
The panel wrote "The ASAP was pleased to note that the NASA exploration systems development division has now established LOC probability thresholds for its programs. The panel was less pleased that these thresholds were not significantly safer than the actual historic performance of the space shuttle.
*****
https://foia.msfc.nasa.gov/sites/foia.msfc.nasa.gov/files/FOIA%20Docs/42/SLS-RPT-077_SLSP-Reliability-Allocation-Report.pdf
See table 3-1, multiply the reliability of each item (including two boosters and 4 engines), and you get 0.993429, or 1 in 152
2014 NASP report: https://oiir.hq.nasa.gov/asap/documents/2014_ASAP_Annual_Report.pdf
Section 3
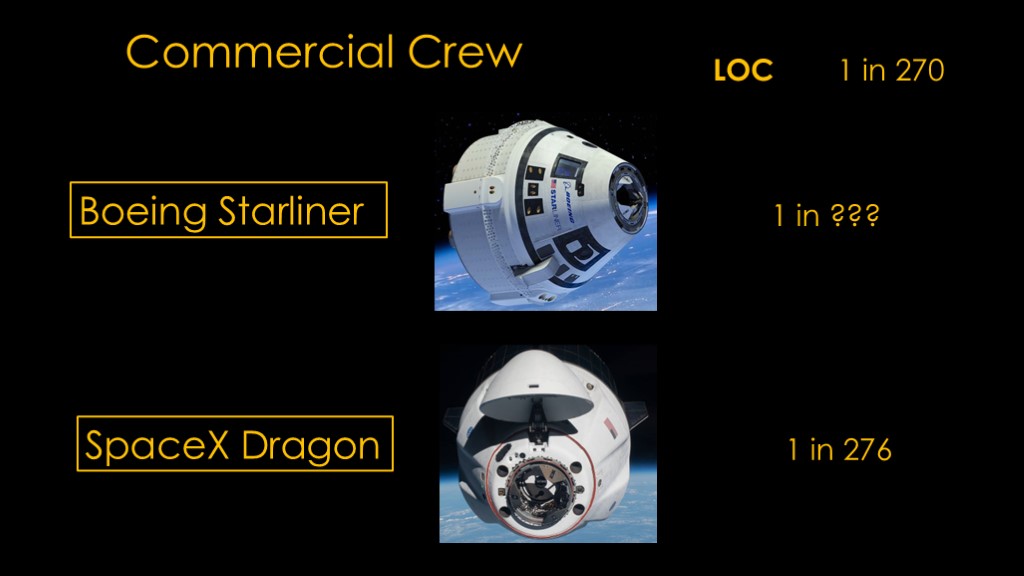
In 2011, the commercial crew program came along, and Boeing and SpaceX were awarded contracts. As part of the contract, the contractors needed to meet a LOC of 1 in 270 for the entire mission including ascent, a 9 month stay on station, and reentry.
This has proven to be quite challenging but SpaceX has been validated to have an LOC of 1 in 276, meeting the requirement.
Starliner has not yet met it's development milestones and therefore it does not have a public LOC.
*****
https://web.archive.org/web/20140113160636/http://www.airspacemag.com/space-exploration/Certified-Safe.html
I knew a lot of NASA history, but I was surprised when I looked at the details.
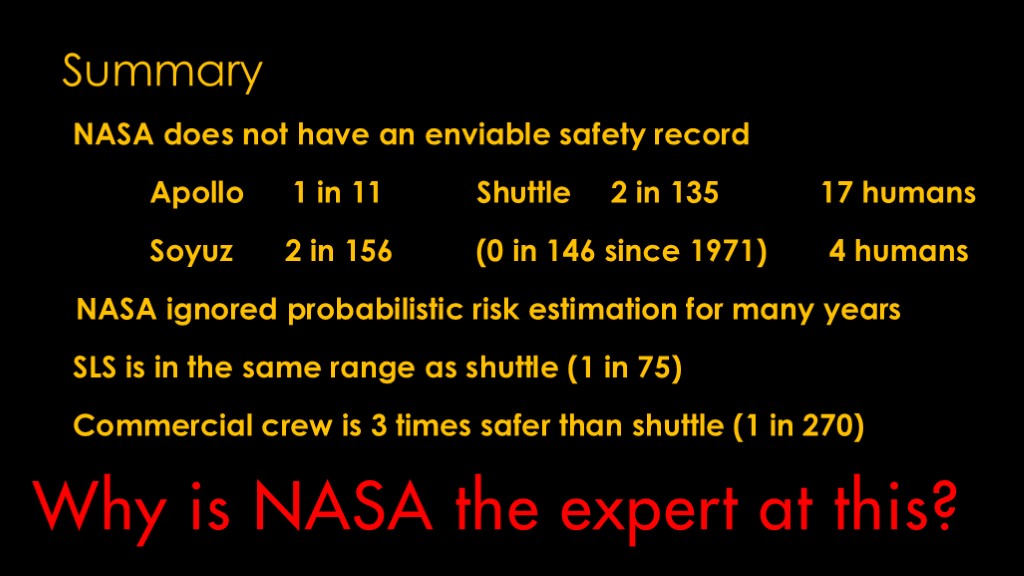
NASA does not have an enviable safety record.
Apollo was somewhere around 1 in 11 for safety, and the shuttle was 2 in 135. Overall, NASA lost 17 humans.
The Russian Soyuz is around 2 in 156, which looks comparable to shuttle, but both losses were early in the program. Since 1971, they have been 0 in 146. Overall, they lost 4 humans.
NASA ignored the best technique for risk estimation for years.
SLS is purportedly only as safe as shuttle, 1 in 75
On the other hand, commercial crew has a threshold of 3 times safer than shuttle at 1 in 270. SpaceX has delivered that with Dragon, and Boeing is currently under certification of that Starliner.
Why is NASA the expert at this? My point is not to denigrate the skills or dedication of NASA employees, but as an organization the s have not been impressive.
If you enjoyed this video, please tell your cat
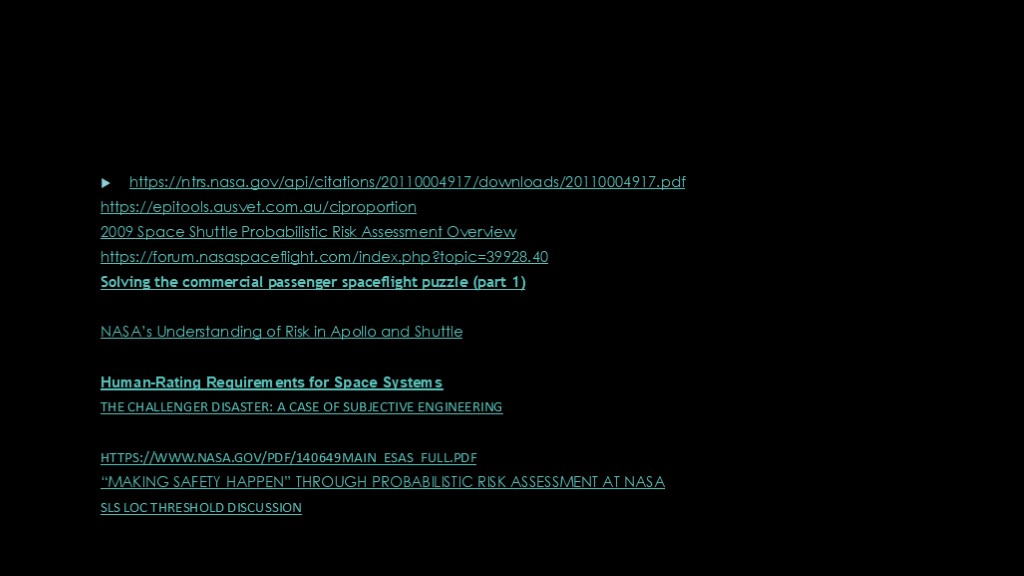
Interestingly, an issue cropped up with Ares I.
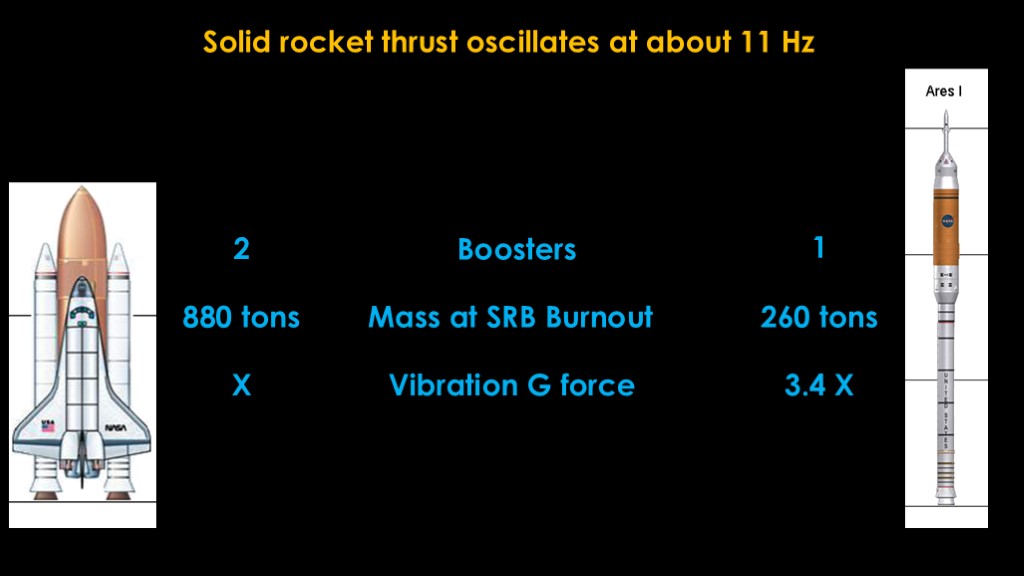
The thrust on space shuttle rocket boosters oscillates at about 11 Hz. The Space shuttle has two boosters where the oscillations of the two boosters will tend to cancel out the vibration rather than reinforce it.
The shuttle stack weights about 880 tons at SRB burnout while the Ares I stack weighs about 260 tons at SRB burnout.
That means that the vibrations due to thrust variation will be around 3.4 times worse with Ares I compared to shuttle even without the smoothing effect of two boosters.
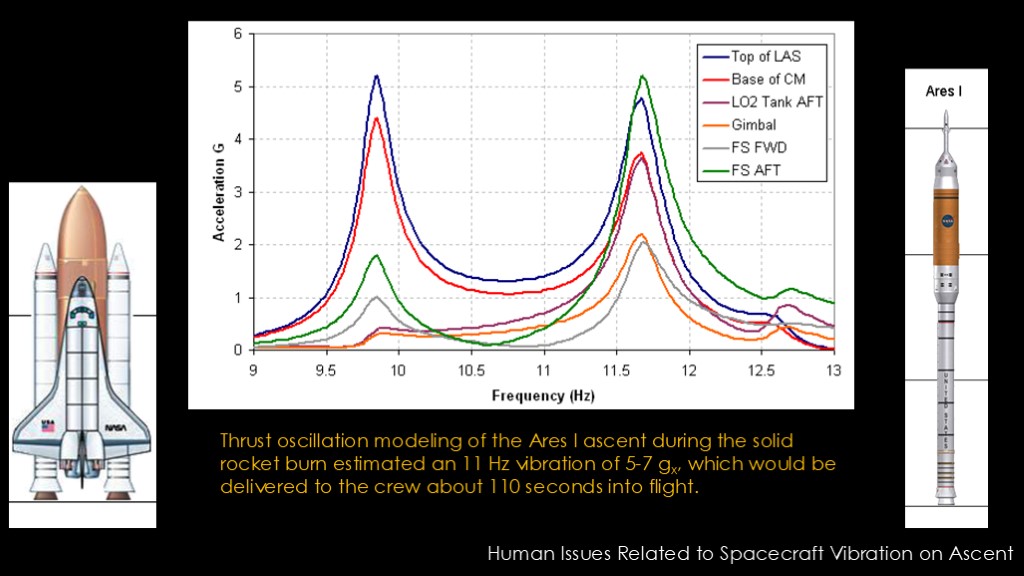
Here's a modeling of the Ares I ascent. It shows near the end of the solid rocket booster the oscillation will be an 11 Hz vibration of 5-7 g.
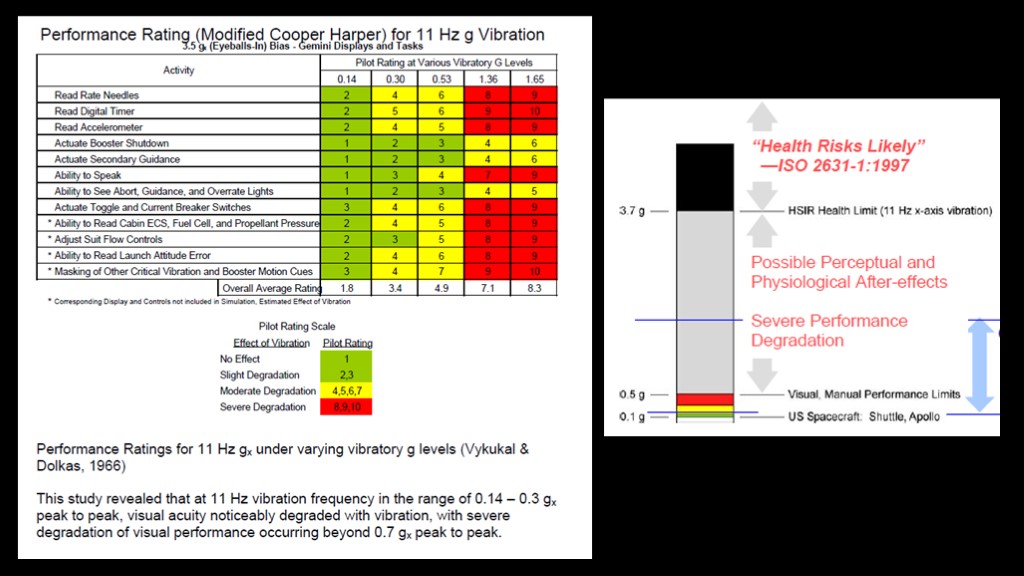
There have been studies that looked at the effect of vibration, and once you get to 0.5 g, you see significant effects. Above 3.7 g is likely to cause health problems.
Ares I is expected to be 5-7 Gs. This is not only bad enough to break astronauts, it's bad enough to break equipment as well.
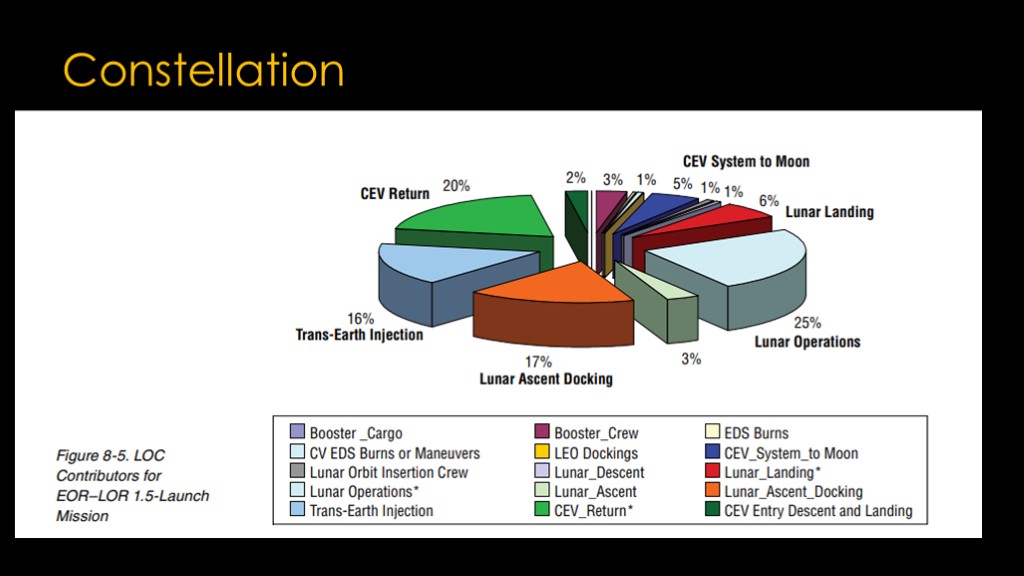
Before we move on from constellation, I do want to share one chart with an important point.
This is for a lunar launch mission. Note that the booster launch only provides 3% of the risk in the mission; the lunar operations are much more likely to lead to LOC events than the launch.
The point here is a risk that might be high on a mission to ISS might be minimal on a lunar mission.